Reports
Reports turns what's in your account into charts, totals and lists. Click Reports in the sidebar.
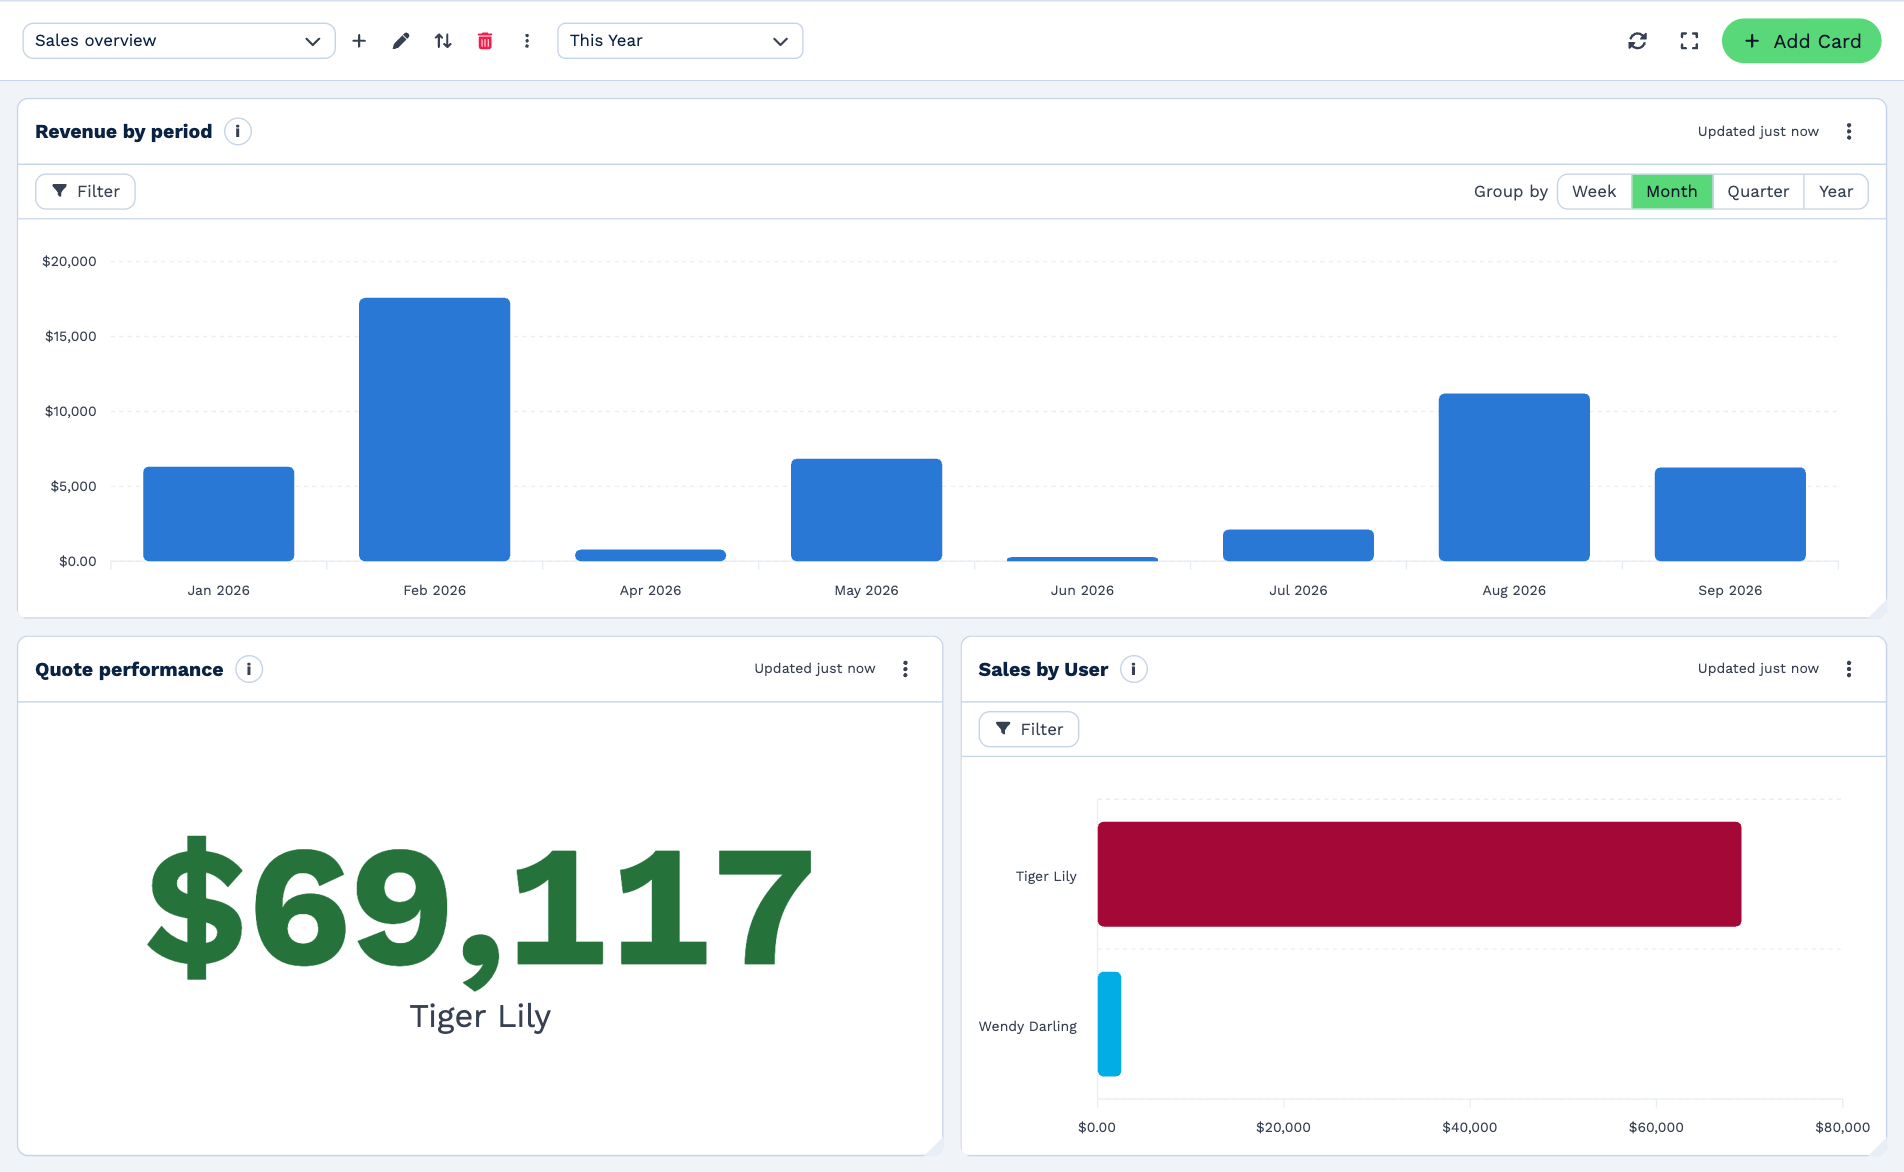
Who can do this
Anyone with Reports Access. Cards about invoices and quotes also need View Invoices. If Reports isn't in your sidebar, ask an administrator (User Rights).
How it's put together
- A dashboard is a page of reports with a name, such as Sales overview. You can have as many as you like.
- A card is one report on a dashboard: a chart, a total, or a list.
- The date range at the top applies to every card on the page.
Your account starts with four dashboards to get you going: Sales overview, Pipeline health, Call center and Accounting. Change them, add to them, or remove them.
Dashboards belong to the whole account. Everyone with Reports Access sees the same dashboards and cards, and anyone can change them.
-
Create and manage dashboards
Start blank or from a template; rename, reorder, duplicate and delete.
-
Add and change cards
Pick a report, choose how it's drawn, filter it, and arrange the page.
-
Read the numbers
The date range, time zone, who sees what, and what each total counts.
-
Card reference
Every card you can add, by group.
-
Download, share and show
Save a card as a spreadsheet or picture, copy a link, or put a dashboard on a screen.
On a phone
You can view reports on a phone. Adding and changing dashboards and cards is done on a computer.